The page uses extensive data analysis to generate probabilities of aurora at high and mid latitudes, plus at a user location obtained either from the user’s device location or manual entry of lat and long. Nowcasts and forecasts are generated from NOAA alert files through text file parsing and logic combined with live data.
The dashboard will alert the user if a new version is published whilst they have a session open, else the latest version will load as soon as the page is opened or refreshed.
An alarm function is built in which provides alert tones and voice notification on the local device. Alert levels are selectable, along with a “moon filter” which will supress the alarm should the moon be illuminated more than the user selected value. Alarms can also be forward via Pushover to the user’s mobile device – a Pushover account on the free tier is required and the user must enter credentials via the settings pop up to make it work. In testing I’ve found that Pushover provides alerts with almost zero lag and is very reliable, as long as the page on the home machine is left active!
[2025-12-26] I’ve long had issues in getting Google to list my site properly in search listings. I’m not an expert and never quite got it right!
I’ve added some (anonymous) user tracking to the site in order to understand the number of visitors and what pages they like to use, and to help me get the site listed properly. As a consequence, site cookies are generated in order to facilitate the tracking. This is a fact of life on numerous websites where tracking is used a lot for marketing purposes. My site is non-commercial and no marketing activity takes place on it or in the background.
A further consequence of enabling tracking is that I must comply with GDPR and privacy policies, therefore users may see a cookie consent popup. I urge acceptance so that I can see how visitors are using the site.
[2025-12-01] Adjusted parameters for the solar wind dashboard indicators for both Live Solar Events and Earth Geomagnetic Environment pages
Added animating NASA SWPC ENLIL Solar Wind Model to Earth Geomagnetic Environment page
[2025-12-02] Swapped some elements of the Live Solar Events and Earth Geomagnetic Environment pages around as they had become a bit chaotic and were not following the spirit of the page titles as intended.
“Live Solar Events” primarily deals with events on or near the sun, quick impact Earth effects caused by Xray, Electron, Proton storms and the like. “Earth Geomagnetic Environment” mainly deals with the detection of Earth and near-Earth geomagnetic storms.
[2025-12-11] Added Solar Wind IMF Graph to Earth Geomagnetic Environment page. Make various tweaks to indicators and graphs.
Added NOAA Space Weather Warnings and Alerts Messages block to Live Solar Events and Earth Geomagnetic Environment pages. The block dynamically adjusts the maximum number of displayed messages to six whilst varying the time since the oldest issued message between 12 and 3 hours (sounds more complicated than it should be!)
[2025-12-15] Added a new page “Auroral Viewing Probabilities“ The page links to a stand-alone page titled “Auroral Activity Now”. On this page you’ll find auroral viewing predictions for high- and mid-latitudes plus a custom location via user entry lat/long. Auroral probability is determined from live solar wind data and is updated once per minute. 0% probability means, based on the current solar wind, that there would be absolutely zero chance of seeing aurora at that location. 100% implies with certainty that aurora will be visible. Anything below 100% makes it more unlikely that aurora will be visible.
Location list: Over 100 locations worldwide are tested with the parameters every minute. Any scoring above 50% will be listed in the lower half of the page along with their percentage probability, rotating through a maximum 10 locations at a time.
Locations are also checked via online API calls to test if they are in night time or not. Daytime locations are not listed. Geomagnetic pole offset is built into the coding to aid accuracy.
The page is in Beta testing so expect further modifications or corrections to be made. I’m currently awaiting a good solar storm to test the algorithms!
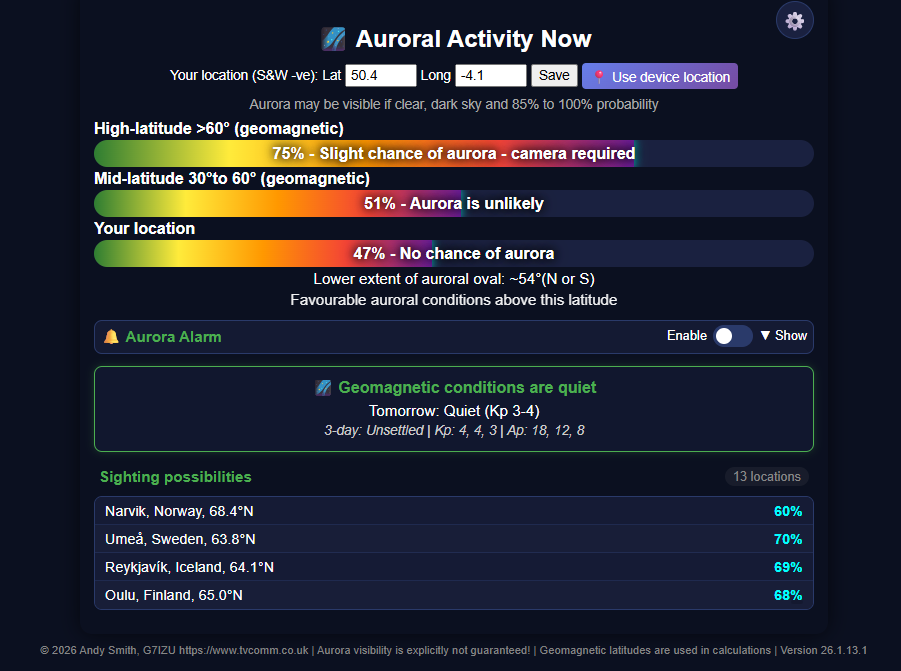
[2025-12-24] Auroral Activity Now The Aurora probabilities page has been completed. The page is designed to be an extra tool for aurora hunters and photographers when determining if aurora is visible at their exact location. If you have guests who are always asking “Will we see the aurora tonight?” you’ll be able to show them this page and make a determination with some reasonable accuracy.
The page draws on live Nasa, NOAA and local magnetometer data to create probabilities for visual aurora at high-latitudes, mid-latitudes and and user-selected location. An estimate of the lower extent of the aurora oval is given. If the moon is up, the percentage of lunar illumination is shown. Alert banners show is there’s a substorm or full geomagnetic storm in progress. An audible alarm with speech announces commencement of storms, and whether aurora is now visible at the user location. An three-line geomagnetic forecast for the next three days is shown. A the bottom of the page probabilities are shown for locations around the world (if their probability is >=60%).
by admin·Comments Off on Website update Nov 2025 #2
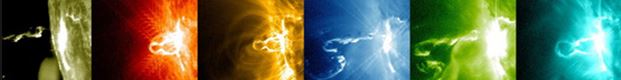
2025-11-24 Live Solar Events: Replaced static image of SDO AIA94 solar image with a 15 frame, 6 fps movie version.
The movie is captured one frame every 15 minutes and covers approximately four hours. New frames are added automatically as they become available.
2025-11-26 Live Solar Events: Added three further dashboard indicators for Real-time Solar Wind density, speed and pressure. The pressure value is calculated from the density and speed values and is not a value provided by Nasa or NOAA.
Changed the Xray, Electron and Proton graphs from linear to logarithmic scales.
[2025-11-14] The tops of the Live Solar Events and Earth Geomagnetic Environment pages have fully working space weather dashboards with indicators showing XRay Flux, Radio Blackout Level, Electron Flux, Solar Radiation (Proton) Flux, Geomagnetic Storm Level and Kiruna Sub-Storm Level. The Radio Blackout, Solar Radiation Storm and Geomagnetic Storm Levels are matched to the NOAA space weather storm scales. The Electron Flux levels do not have published warning levels, so the levels shown on the indicator are un-official.
These indicators are driven from NOAA and Kiruna data and they update in almost real-time. The XRay, Electron and Proton flux indicators show the highest value recorded during the last hour. The Geomagnetic Storm Level (derived from Kp) is shown for the 3 hour block as shown on the indicator. This indicator only updates every 3 hours (eg. 00h, 03h, 06h etc). The Kiruna K level sub-storm indicator shows the highest level in the last 30 minutes or so. This indicator tends to be the most active.
You’ll notice the “♫” icon underneath. This is to show that the indicators make a chiming sound when values of Moderate and above are shown. The note of the chime is higher if the warning level is higher! I did try to add an audio mute button in case it gets annoying, but so far I’ve not been able to make it work.
2025-10-23 Live Solar Events: Added locally generated text indicators to the top of the page for Xray, electron and proton flux. I’m moving away from third party graphics for these indicators.
About The Colourgram: Added file download options for the latest offline versions of the XRay Flux colourgram. The colourgram pages include speech output which announces flux values as flares rise above M-level, try to predict the peak then summarize the flare after the flux has dropped to below M-level. The online version is based on an earlier iteration so is not as good.
Sidebar: Added Solar Terrestrial Data information block (N0NBH)
by admin·Comments Off on A few changes to this website
I’ve made a few changes and fixes to the site in the past week or two.
Bug fixes: For a long time, a number of third party images were not displaying correctly on browsers configured to only allow SSL sources. This was because those images were not hosted on SSL compliant sites (https). I’ve fixed this by transferring the images first to my own SSL compliant server and serving the images to the website from there.
Additions/changes: The Atlantic HF propagation map has been re-designated as the “Atlantic MF/HF Propagation Map” with 30 minutes line persistence. In addition, I’ve provided two more identical Atlantic MF/HF maps but with 20 and 10 minutes line persistence respectively. These are being used to test the responses of the maps to solar storm radio blackouts. A new VLF SID monitoring plot has been added on a new page which is also there to monitor solar storms.
Deletions: These lesser used maps have been removed from the site: MF propagation map; Europe Sporadic-E (no skimmers) Map; Pacific Sporadic-E Map. If you are missing these particularly, please contact me through Twitter @g7izu so that I can sympathise.
by admin·Comments Off on Listen to your home SDR Radio any time, any place
This article describes how to listen to multiple channels of HF and VHF utility radio services on a mobile phone, sourced from my SDR receivers at home. If you don’t have the time to always be in your radio shack to hear the action, this article is for you.
I will not explain how to install SDRs, antennas and computer programs. I’ll just tell you how to link them together to obtain the required result. It is assumed that the reader is already familiar with how SDRs and computers work.
I’m running an SDR Play RSP1a with 8 MHz bandwidth tuned to the MF and lower HF bands, plus an RTL Dongle tuned to 2 MHz of the lower part of the VHF Marine Band. The VHF SDR is fed from a discone antenna which is located on my chimney. The RSP1a is fed from a YouLoop located at ground level, but sometimes I take a split from the Discone feed depending upon the interference level. Channels regularly monitored include 2182, 3924, 5680 kHz, and a variety of public VHF marine channels.
Hardware prerequisites (for my setup): 2x SDR receivers (SDR Play RSP1a, RTL Dongle R280T) Desktop computer running Windows 10 64bit (i7 9700 3GHz processor, 32GB RAM) 1 TB SSD Hard drive for OS and SDR applications Samsung Galaxy S8 phone (with a large data plan) Discone antenna (no preamp) YouLoop MF/HF/VHF antenna (no preamp)
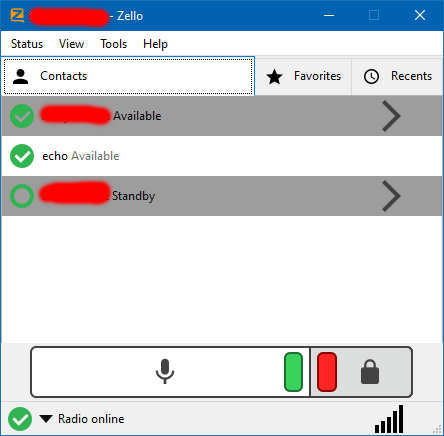
What to do? Zello is the hub of this exercise. It’s a “walkie-talkie” application designed to be used for audio chat across the internet on public or private channels, using “push-to-talk” or VOX (voice operated switch) methods. There are mobile versions for iPhone and Android, plus a PC version. There are also personal and business versions. The Zello website steers you towards the paid version without mentioning the free personal one, so follow my link and sign up for free. You can send audio from your home computer to your mobile phone (and vice-versa if needed).
Zello (Android version)
Install the mobile app to your phone and the PC version to your computer. Open one or other and create an account. On the other device create a different account, and log in to both. Add each account as a contact on each device.
Zello allows users to set up public channels, but we’re not going to create a channel for this purpose. Public channels are unencrypted, and anyone can listen in (unless you wish to make your PC’s audio public, of course!) The connection between your PC and mobile will be via a direct “user to user” link, which remains encrypted and private. If you have more friends who you want to have listen in, they can also be added as contacts.
Next, install and configure the virtual audio cable on your PC, if you don’t already have one. The SDR(s) will need squelched audio to be fed to the virtual cable input, with Zello listening to the same virtual cable output (in Tools, Options, Audio). In my example I’m using VB-Audio Cable B.
Put Zello into “VOX” mode on the PC (in Tools, Options, Vox). Test it with the default settings and adjust the thresholds and trigger times later if needed.
Start your SDR software (in my case SDR Console v3) and set up the multiple tuners listening to your channels of interest. Ensure that the audio is squelched so that noises bursts are minimised, and select the virtual audio device for the output. If you have further SDRs for different bands, open “new instance” for each one with a different (saved) configuration from SDR Console’s menu and repeat the exercise, outputting the audio to the same virtual cable. Check that the squelch is enabled with the threshold as low as possible before noise causes it to break.
Now, when the SDR’s squelch opens, audio is sent through your Zello account as the VOX keys the link via the Zello servers and onwards to your mobile. The Zello system has the advantage of storing your incoming audio messages, so if you miss something you can scroll back through the history and replay it. You can also set the history to be kept for varying lengths of time.
To make things ultimately flexible, connect your phone via Bluetooth to your car audio system for when driving around, or to an earpiece for private listening.
And finally, a gratuitous picture of one of my curious cats…
by admin·Comments Off on Starlink threatens not only optical astronomy, but now radio astronomy too!
This article was first published on Sciencemag.org on 9th October 2020.
Starlink already threatens optical astronomy. Now, radio astronomers are worried
The 197 radio astronomy dishes of the Square Kilometre Array (SKA) in South Africa will sit within a radio-quiet zone the size of Pennsylvania where even a cellphone is forbidden, to preserve the array’s views of the heavens. Yet that precaution won’t save the telescope, due to be completed in the late 2020s, from what may soon be overhead: tens of thousands of communications satellites beaming down radio signals straight from the heavens. “The sky will be full of these things,” says SKA Director General Phil Diamond.
The rocket company SpaceX has already launched hundreds of Starlink satellites, the first “megaconstellation” intended to provide internet service to remote areas. The satellites have aroused the ire of optical astronomers because of the bright streaks they leave across telescopes’ fields of view. Now, radio astronomers are worried, too. This week, SKA released an analysis of the impact that Starlink and other constellations would have on the array. It finds they would interfere with one of the radio channels SKA plans to use, hampering searches for organic molecules in space as well as water molecules used as a key marker in cosmology.
SpaceX is promising to address the concern. But radio astronomers are also seeking regulations. The United Nations Office for Outer Space Affairs (UNOOSA), which discussed the SKA analysis at a workshop this week, is considering ways to keep satellites from polluting the night sky with light and radio signals, not just for astronomy, but also for wildlife and the public. Astronomers also hope the International Telecommunication Union (ITU), a U.N. organization, will step in. “The radio spectrum is a resource that is being consumed by private companies that typically have no regard for science,” says radio astronomer Michael Garrett, director of the Jodrell Bank Centre for Astrophysics in the United Kingdom. “It’s only government intervention that can stop this state of affairs in my view.”
So far, SpaceX has launched more than 700 Starlinks out of an initial goal of 1440, and it has won approval for 12,000. Other operators, such as OneWeb and Amazon’s Project Kuiper, have similar ambitions. Studies suggest wide-field optical surveys will be worst affected, with satellite tracks marring most images. The team building the Vera C. Rubin Observatory, a survey telescope in Chile due to see first light next year, has been working with SpaceX to reduce the impact. The company has changed the orientation of satellites as they move up to their final orbit, painted them a less reflective color, and fitted “visors” to reduce reflections. Since August, all launched Starlink satellites have visors, SpaceX’s Patricia Cooper, vice president for satellite government affairs, told the UNOOSA workshop this week. “We’re trying to look for a path where we can coexist,” she said.
The analysis from SKA, which when complete will be the world’s largest radio observatory, highlights the new concern. The band that Starlink uses to beam down internet signals takes up a sizable chunk of frequencies from 10.7 to 12.7 gigahertz, within a range known as band 5b that is one of seven bands SKA’s South African dishes will target. The SKA analysis calculated the impact of 6400 satellites, taking into account both direct signals and leakage called “side lobes.”
The team calculated that satellite transmissions will lead to a 70% loss in sensitivity in the downlink band. If the number of satellites in megaconstellations reaches 100,000, as predicted by many, the entire band 5b would be unusable. SKA would lose its sensitivity to molecules such as the simplest amino acid, glycine, a component of proteins. “If it was detected in a planetary system that was forming, that would be a very interesting piece of information,” Diamond says. “This is a new area that SKA is opening up.” The band could also contain the fingerprints of water molecules in distant galaxies, a tracer that cosmologists use to study how dark energy is accelerating the expansion of the universe.
Since 1959, ITU has protected a number of narrow frequency bands for astronomy. But in recent decades, digital receivers have allowed telescopes to “operate over the whole spectrum,” Diamond says. “We’ve learned to coexist with transmitters,” typically by excluding them from a radio quiet zone or siting telescopes in remote areas. But they have no control over transmitters flying overhead.
Radio astronomers want the satellite operators to turn off their transmitters, move to other bands, or point them away, when they are flying over a radio observatory. Tony Beasley, director of the U.S. National Radio Astronomy Observatory, says they have been discussing these options with SpaceX. “In the next year or two, we will be doing tests where we’re going to be trying to coordinate in real time, technically, with them.” Beasley says this is a reflection of SpaceX’s corporate culture: “They want to do cool stuff; they don’t want to do any harm.”
Other astronomers don’t want to count on corporate goodwill. At the UNOOSA workshop, they pushed for two recommendations: that all future satellites in low-Earth orbit be designed to avoid beaming at radio telescopes and radio quiet zones, and that they control the leakage from their side lobes. Those recommendations, along with others discussed this week for protecting optical observatories, will be debated at a series of U.N. subcommittees next year before going to UNOOSA and, ultimately, the U.N. General Assembly for approval.
Beasley is philosophical about the situation. “SpaceX is legally transmitting inside one of their bands and there are going to be impacts for anyone trying to do radio astronomy,” he says. “These spectrum allocations represent the goals and intent of society. We make [them] to enable commerce and to enable defense and all kinds of activities. We have to come to a solution that satisfies all these to some extent.”
*Correction, 12 October, 7:30 a.m.: An earlier version of this story incorrectly stated that glycine is a component of DNA.
by admin·Comments Off on It all started with a trip around Saturn…
And then I met Lara Croft! But this story doesn’t have a happy ending…
I have a very modest PC which runs 24/7 in support of my website. The on board 800MHz graphics was fine for most things, but not particularly good for gaming.
For years I’ve been following a development called Space Engine. The program (for PC) has been in beta mode for at least five years. It’s a graphics hungry universe simulator which recreates the known (and unknown) universe on a scale of 1:1. It’s totally awesome. It ran reasonably well on my machine when set with the lowest graphics settings, and I loved it.
About a month ago, Space Engine launched its first paid (but still under development) version on Steam. It costs just under £20. To cut a shortish story even shorter, it didn’t run at all with my graphics card. This was kind of expected, although disappointing. I needed to upgrade the graphics card, so I bought the (recommended) Nvidea Geforce GTX 1060 for about £180.
Yay! It ran perfectly for all of… 10 minutes. As the graphics became more complex (ie when cruising near a super-massive black hole), the PC fans got faster and faster, then it shut down. That’s the thermal protection kicking in… but that’s not surprising that close to a black hole. To get an idea, check out this video: https://youtu.be/eYp-IEz_i6E?t=3530
In fact I found that it crashed the computer far too often, and I soon realised that I should make sure the graphics firmware was up to date. Sure enough, the supplied driver version was about six months old. The update and some lowering of the graphics card clock speeds reduced the number of crashes.
Now, what’s this all got to do with Lara Croft? Well, I’ll tell you. Nvidea were bundling Shadow of the Tomb Raider with the graphics card, so it occurred to me that they would only do this if they were confident that the card would run ok with it without getting too hot. As I wouldn’t normally play games like this (mainly due to my rubbish system!) I gleefully downloaded the massive 28GB game overnight, and gave it a try.
It seemed to run fine, (except Lara seems to look a bit like Princess Fiona from Skrek, but that’s not going to be the fault of my system).
I digress… So I ran the game for about 10 minutes, playing through the intro and in-game videos with ease, and then on to some actual game play. I then hear the fans in my PC winding up the revs faster and faster as the intensive jungle scenes are shown. “Ah!” me thinks, “This game is supposed to run fine with this graphics card, else they wouldn’t have offered it for freeeee!!”
It was the last thought I had before… BANG! Followed by electrical crackling noises, and my screens went dead. The strong and sweet smell of burnt insulation wafted around the room and all was quiet, except for my daughter calling from the room next door “Dad, what just happened?”
I fear that I should have heeded the warning signs when I was orbiting Saturn a couple of days ago…
So, the long and the short of it is that I hadn’t checked the power budget and it blew at least one resistor in the power supply.
The GTX 1060 requires 400W. My PC had a 500W PSU. It also had a motherboard with a 4 GHz CPU, three disc drives and multiple fans to supply. The picture above is the result.
So, an 850W PSU is on the way, costing another £55.
My appointment with Lara is on hold… so meanwhile here is a video of Space Engine on Youtube for you to enjoy.
Manage Consent
To provide the best experiences, we use technologies like cookies to store and/or access device information. Consenting to these technologies will allow us to process data such as browsing behaviour or unique IDs on this site. Not consenting or withdrawing consent, may adversely affect certain features and functions.
Functional
Always active
The technical storage or access is strictly necessary for the legitimate purpose of enabling the use of a specific service explicitly requested by the subscriber or user, or for the sole purpose of carrying out the transmission of a communication over an electronic communications network.
Preferences
The technical storage or access is necessary for the legitimate purpose of storing preferences that are not requested by the subscriber or user.
Statistics
The technical storage or access that is used exclusively for statistical purposes.The technical storage or access that is used exclusively for anonymous statistical purposes. Without a subpoena, voluntary compliance on the part of your Internet Service Provider, or additional records from a third party, information stored or retrieved for this purpose alone cannot usually be used to identify you.
Marketing
The technical storage or access is required to create user profiles to send advertising, or to track the user on a website or across several websites for similar marketing purposes.