

This map includes all reported amateur communication modes including digital modes and skimmer reports, and also sporadic-E Band 2 FM spots via fmlist.org.
It should not include any F2 propagation reports, but errors do creep in. Long distance Es on 6m are sometimes mis-reported as F2 contacts and vice-versa. To see long-distance contacts see the hemisphere “Es” maps. FM spots are provided courtesy of fmlist.org.
NEW: View video of the last few hours’ activity webcam.io

Analogue and Digital modes are shown.
The map above is auto-refreshed every minute or so. It’s generated by the application LiveMUF by Dave Edwards, G7RAU. This application is available to licenced radio amateurs to produce their own propagation maps.
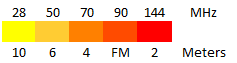
KEY:
Coloured lines indicate sporadic-E propagation reported in the following frequency bands during the last 10 minute period:
The calculated MUF (Maximum Useable Frequency) is also shown on the map at the mid-point square, where the assumed ionospheric refraction occurs.
Click on the image to open it on a new tab and view the data block in the bottom left corner, which includes the date and the start/end times for the 10 minute period of the current map in UTC.