
This map is displays tropo contacts reported on the 10m band up to the GHz bands. Occasionally mis-reported contacts via satellite may be shown which display longer distances than are achievable via traditional tropo.
The map above is auto-refreshed every minute. It’s generated by the application LiveMUF by Dave Edwards, G7RAU. This application is available to licenced radio amateurs to produce their own propagation maps.
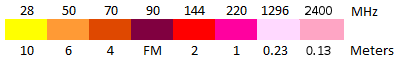
KEY:
Coloured lines indicate Tropospheric propagation reported in the frequency bands during the last 30 minute period according to the colour key above the map.
No-lines visible = No propagation reported
White parallel lines crossing the map = day/night terminator
Yellow star = Sub-solar point
Click the image to expand: The data block in the bottom left corner includes the date and the start/end times for the 30 minute period of the current map in UTC.
Learn about the various types of “Tropo” propagation: [OZ1RH Troposcatter inside and out]