by admin·Comments Off on Website update Nov 2025 #2
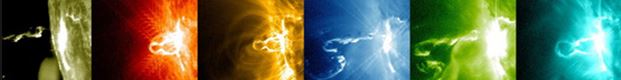
2025-11-24 Live Solar Events: Replaced static image of SDO AIA94 solar image with a 15 frame, 6 fps movie version.
The movie is captured one frame every 15 minutes and covers approximately four hours. New frames are added automatically as they become available.
2025-11-26 Live Solar Events: Added three further dashboard indicators for Real-time Solar Wind density, speed and pressure. The pressure value is calculated from the density and speed values and is not a value provided by Nasa or NOAA.
Changed the Xray, Electron and Proton graphs from linear to logarithmic scales.
[2025-11-14] The tops of the Live Solar Events and Earth Geomagnetic Environment pages have fully working space weather dashboards with indicators showing XRay Flux, Radio Blackout Level, Electron Flux, Solar Radiation (Proton) Flux, Geomagnetic Storm Level and Kiruna Sub-Storm Level. The Radio Blackout, Solar Radiation Storm and Geomagnetic Storm Levels are matched to the NOAA space weather storm scales. The Electron Flux levels do not have published warning levels, so the levels shown on the indicator are un-official.
These indicators are driven from NOAA and Kiruna data and they update in almost real-time. The XRay, Electron and Proton flux indicators show the highest value recorded during the last hour. The Geomagnetic Storm Level (derived from Kp) is shown for the 3 hour block as shown on the indicator. This indicator only updates every 3 hours (eg. 00h, 03h, 06h etc). The Kiruna K level sub-storm indicator shows the highest level in the last 30 minutes or so. This indicator tends to be the most active.
You’ll notice the “♫” icon underneath. This is to show that the indicators make a chiming sound when values of Moderate and above are shown. The note of the chime is higher if the warning level is higher! I did try to add an audio mute button in case it gets annoying, but so far I’ve not been able to make it work.
Manage Consent
To provide the best experiences, we use technologies like cookies to store and/or access device information. Consenting to these technologies will allow us to process data such as browsing behaviour or unique IDs on this site. Not consenting or withdrawing consent, may adversely affect certain features and functions.
Functional
Always active
The technical storage or access is strictly necessary for the legitimate purpose of enabling the use of a specific service explicitly requested by the subscriber or user, or for the sole purpose of carrying out the transmission of a communication over an electronic communications network.
Preferences
The technical storage or access is necessary for the legitimate purpose of storing preferences that are not requested by the subscriber or user.
Statistics
The technical storage or access that is used exclusively for statistical purposes.The technical storage or access that is used exclusively for anonymous statistical purposes. Without a subpoena, voluntary compliance on the part of your Internet Service Provider, or additional records from a third party, information stored or retrieved for this purpose alone cannot usually be used to identify you.
Marketing
The technical storage or access is required to create user profiles to send advertising, or to track the user on a website or across several websites for similar marketing purposes.