This “course” is compiled and condensed from various online articles with the assistance of AI. The list of sources used appears at the end of the page. The course, in 11 parts no longer than 200 to 300 words each, is intentionally very brief. The hope is to give the reader an understanding of the basic concepts in as short-a-time scale as possible.
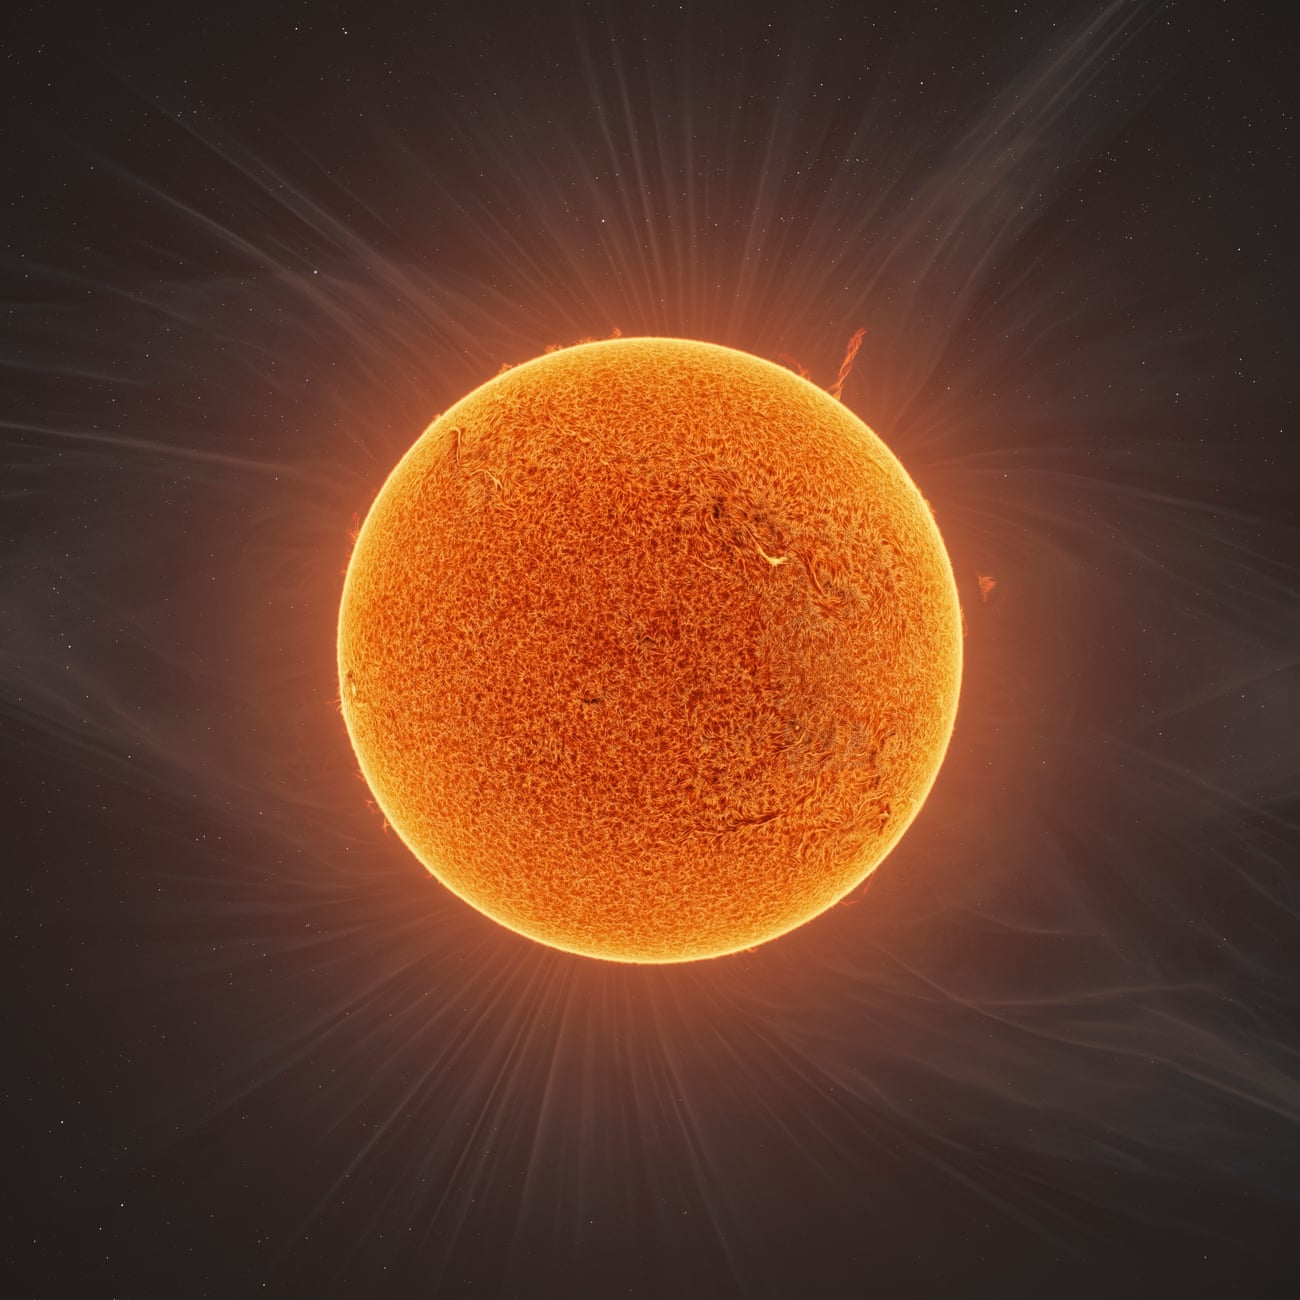
The Sun (Photograph: ©2023, Jason Guenzel and Andrew McCarthy, All Rights Reserved)
Part 1: The Sun: Engine of Space Weather
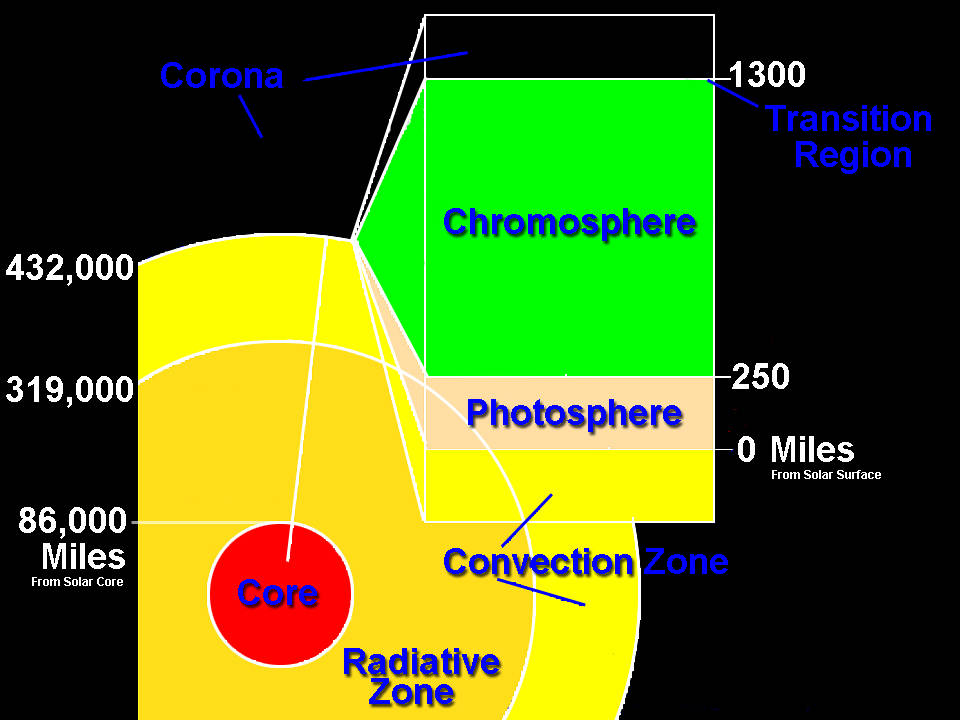
This graphic shows a model of the layers of the Sun, with approximate mileage ranges for each layer.
The Sun is a magnetically active star composed primarily of hydrogen and helium. Its energy is produced through nuclear fusion in the core, but space weather originates in its outer layers—especially the corona, the Sun’s extremely hot, diffuse atmosphere.
Solar magnetic fields are dynamic and complex, generated by the Sun’s internal dynamo. These magnetic fields emerge through the photosphere and shape coronal structures, which can store and release enormous amounts of energy.
Space weather begins when these magnetic fields become twisted, break, or reconnect. This drives a range of energetic events—including solar flares, coronal mass ejections (CMEs), and high-speed solar wind streams—that propagate through the solar system.
The energy and particles released can travel through space and interact with planetary environments, particularly Earth’s magnetosphere and upper atmosphere, causing disruptions to satellites, communication systems, power grids, and navigation.
Understanding the Sun’s activity is the foundation of space weather science.
Part 2: Solar Flares: Sudden Bursts of Radiation
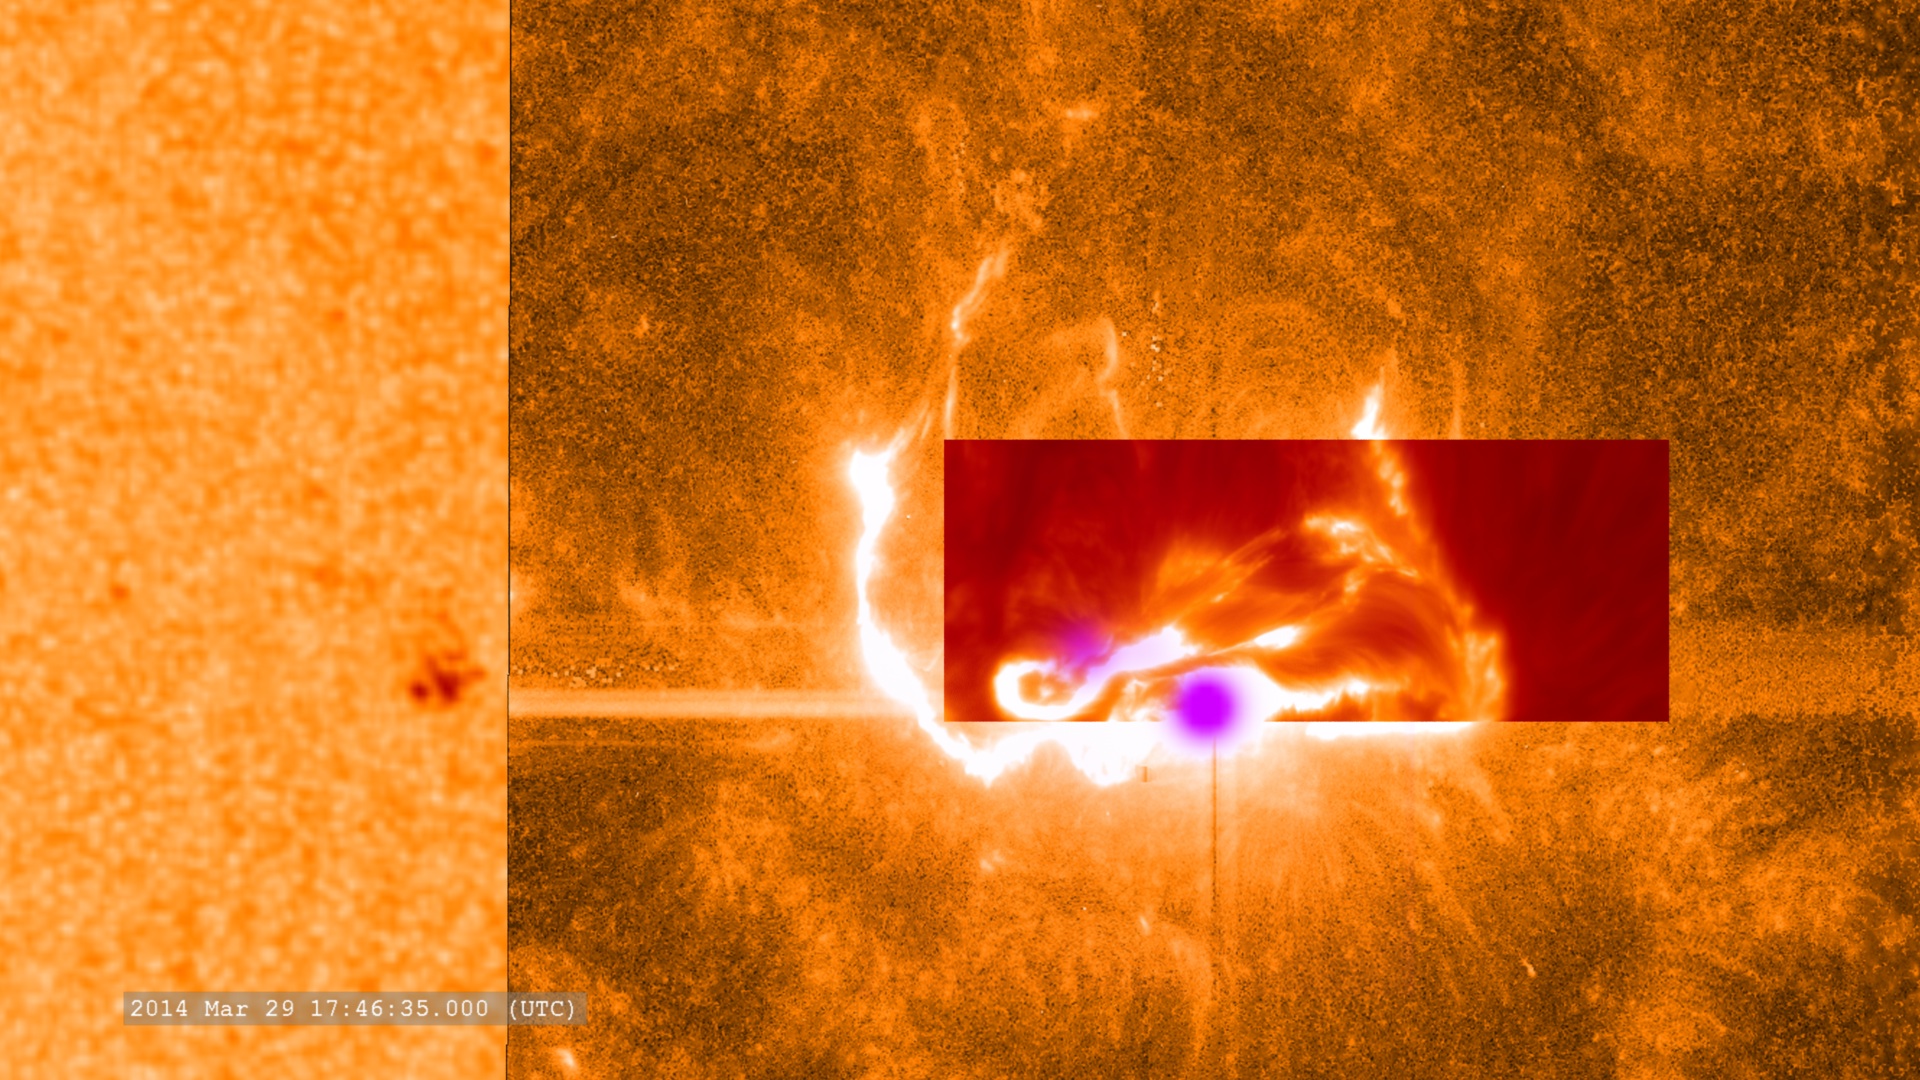
This combined image shows the March 29, 2014, X-class flare as seen through the eyes of different observatories. SDO is on the bottom/left, which helps show the position of the flare on the sun. The darker orange square is IRIS data. The red rectangular inset is from Sacramento Peak. The violet spots show the flare’s footpoints from RHESSI. (NASA Visualization Studio)
Solar flares are intense, rapid releases of electromagnetic energy from localized regions on the Sun, typically near active regions with strong magnetic fields. They are caused by magnetic reconnection—when oppositely directed magnetic field lines break and reconnect, converting stored magnetic energy into kinetic and thermal energy.

A sequence of frames showing a solar flare followed by a CME leaving the surface
Flares are classified by their X-ray brightness in the 1–8 Å wavelength range: A, B, C, M, and X, with X being the most intense. An X-class flare can emit energy equivalent to billions of nuclear bombs in minutes.
Radiation from solar flares travels at the speed of light and can affect Earth within 8 minutes. The most immediate impacts occur in the ionosphere, where increased X-ray and extreme ultraviolet (EUV) radiation enhances ionization. This can disrupt high-frequency (HF) radio communication with radio blackouts, especially on the sunlit side of Earth, and affect GNSS accuracy.
Flares also contribute to the acceleration of energetic particles and can precede or accompany coronal mass ejections.
Solar flares are a key driver of space weather, with effects extending from Earth’s atmosphere to deep space missions.
NOAA R-Scale (Radio Blackouts)
| R-Scale Level | Solar Flare Class | X-Ray Flux (W/m²) | Effects on HF Radio & Navigation | Approximate Frequency (per 11-year cycle) |
|---|---|---|---|---|
| R1 – Minor | M1 | ~1 × 10⁻⁵ | Weak/minor HF degradation; occasional loss of contact; brief navigation signal degradation | ~2000 days (~950 days per cycle) |
| R2 – Moderate | M5 | ~5 × 10⁻⁵ | Limited HF blackout lasting tens of minutes; navigation degradation for tens of minutes | ~350 days (~300 days per cycle) |
| R3 – Strong | X1 | ~1 × 10⁻⁴ | Wide-area HF blackout for about an hour; navigation degraded for ~1 hour | ~175 days (~140 days per cycle) |
| R4 – Severe | X10 | ~1 × 10⁻³ | HF blackout over most of sunlit side for 1–2 hours; navigation outages; minor satellite navigation disruptions | ~8 days (~8 days per cycle) |
| R5 – Extreme | X20 | ~2 × 10⁻³ | Complete HF blackout across entire sunlit side for several hours; navigation signals lost; increased satellite navigation errors | < 1 day (< 1 day per cycle) |
Part 3: Filament Eruptions: Magnetic Structures on the Move

Filaments are seen crossing the face of the sun and erupting as filament eruptions (sidc.be)
Solar filaments—also called prominences when viewed at the solar limb—are large, cooler clouds of plasma suspended above the Sun’s surface by magnetic fields. They appear dark against the solar disk in H-alpha wavelengths due to their lower temperature relative to the corona.
Filaments can remain stable for days or weeks, but when their supporting magnetic structure becomes unstable, they erupt. These eruptions often coincide with or trigger coronal mass ejections (CMEs).
When a filament erupts, it can eject billions of tons of solar plasma into space at speeds ranging from hundreds to over 2,000 km/s. If Earth-directed, the associated CME can reach our planet in 1–3 days, depending on speed.
Erupting filaments and their CMEs can distort Earth’s magnetosphere, potentially triggering geomagnetic storms. The impacts include satellite charging, increased radiation exposure for high-altitude aviation and space missions, and disturbances in power grids and pipeline currents.
Filament eruptions are significant sources of large-scale solar disturbances and are critical to monitoring for space weather forecasting.
Part 4: Coronal Holes: Sources of High-Speed Solar Wind
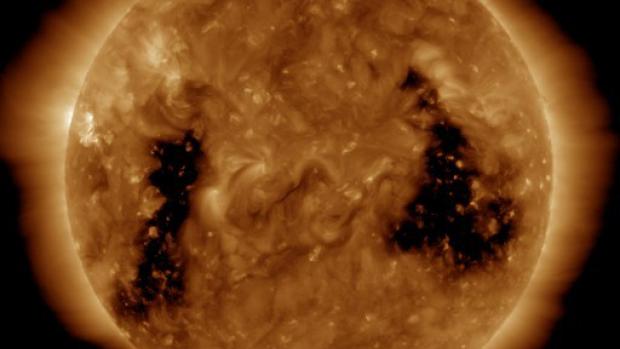
Two large coronal holes (NOAA/SDO)
Coronal holes are regions in the Sun’s corona where magnetic field lines open outward into space rather than looping back to the Sun’s surface. These areas appear dark in extreme ultraviolet (EUV) and X-ray images due to lower plasma density and temperature.
Because the magnetic field is open, coronal holes allow high-speed streams of solar wind—charged particles such as electrons and protons—to escape continuously. These streams can reach speeds of 500–800 km/s, significantly faster than the average solar wind.
High-speed streams from coronal holes interact with slower solar wind ahead of them, forming co-rotating interaction regions (CIRs). When CIRs or the high-speed streams themselves reach Earth, they can compress the magnetosphere and trigger recurrent geomagnetic activity, especially during periods of low solar flare or CME activity.
These effects include enhanced auroras, mild to moderate geomagnetic storms, satellite drag due to thermospheric heating, and disruptions to HF radio propagation and GNSS systems.
Coronal holes are particularly important during the declining and minimum phases of the solar cycle, when they become dominant drivers of space weather.
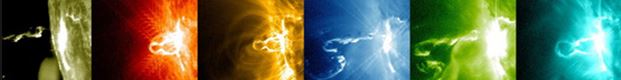
Part 5: Solar Radio and X-ray Bursts
Solar flares and other active solar events emit broadband electromagnetic radiation, including intense bursts in radio and X-ray wavelengths. These emissions originate from energetic electrons interacting with magnetic fields and plasma in the solar atmosphere.
X-ray bursts, mainly from solar flares, are categorized into soft and hard X-rays. They ionize the Earth’s upper atmosphere, especially the D-region of the ionosphere, leading to radio blackouts on the dayside. The NOAA Space Weather Scale rates these from R1 (minor) to R5 (extreme), with X-class flares usually driving R3+ events.
Solar radio bursts are classified into types (I–V) based on their spectral and temporal characteristics:
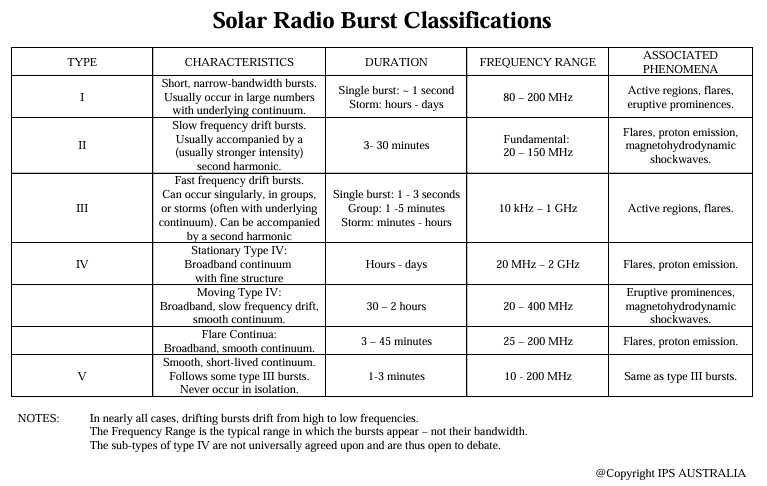
- Type II: Linked to shock waves from CMEs.
- Type III: Caused by electrons streaming along open magnetic field lines.
- Type IV and V: Associated with post-flare loops and trapped electrons.
Type II and III bursts can interfere with radar, GPS signals, and space-based communication. Ground- and space-based radio telescopes detect and classify these bursts in real-time.
Radio and X-ray bursts are among the fastest space weather signatures to reach Earth and are critical for short-term warning systems.
Part 6: Solar Energetic Particles: Proton and Electron Events
Solar energetic particle (SEP) events involve high-energy protons, electrons, and heavy ions accelerated by solar flares and CME-driven shock waves. These particles travel along interplanetary magnetic field lines and can reach Earth within tens of minutes to a few hours.
Proton events are classified by the intensity of >10 MeV protons measured near Earth. A strong SEP event can significantly increase radiation levels in space and at high altitudes over polar regions.
Impacts of SEP events:
- Satellite operations: SEPs can penetrate satellite shielding, causing single-event upsets (SEUs), sensor degradation, and anomalies in spacecraft electronics.
- Aviation: Polar flights may reroute to avoid increased radiation exposure and radio blackouts from ionospheric disturbances.
- Astronaut safety: SEPs pose a serious radiation hazard for crewed missions outside Earth’s magnetic field protection, such as those to the Moon or Mars.
- Ionospheric effects: Enhanced ionization, particularly in polar regions, can disrupt HF communications and degrade GNSS accuracy.
SEP events are monitored by GOES and other spacecraft. Forecasting their onset and intensity remains a challenge, making early warning critical for space operations and aviation planning.
Part 7: Coronal Mass Ejections (CMEs): Massive Magnetic Clouds

Composite image of the sun and a large CME leaving the sun to the west (Spaceweather.com)
CMEs are large expulsions of plasma and magnetic field from the Sun’s corona. Unlike solar flares, which are primarily electromagnetic, CMEs involve bulk mass ejection—up to 10¹³ kg of solar material traveling at speeds of 250–3,000 km/s.
CMEs are often associated with filament eruptions and flare activity. Their impact on Earth depends on:
- Speed: Faster CMEs compress Earth’s magnetosphere more intensely.
- Direction: Only Earth-directed (so-called “halo” CMEs) cause significant effects.
- Magnetic orientation: A southward-oriented interplanetary magnetic field (IMF) within the CME couples more effectively with Earth’s northward geomagnetic field, increasing geomagnetic storm potential.
A CME can reach Earth in ~15–72 hours. When it arrives, it can trigger:
- Geomagnetic storms: By transferring energy into Earth’s magnetosphere.
- Ground-induced currents: Affecting power systems and pipelines.
- Satellite drag: From atmospheric heating and expansion.
- Navigation/radio disruption: Due to ionospheric disturbance.
Strong CMEs are the primary drivers of severe space weather events. Monitoring systems like SOHO and STEREO track their speed and trajectory to enable early warnings.
Part 8: Solar Wind: Constant Stream, Variable Impact
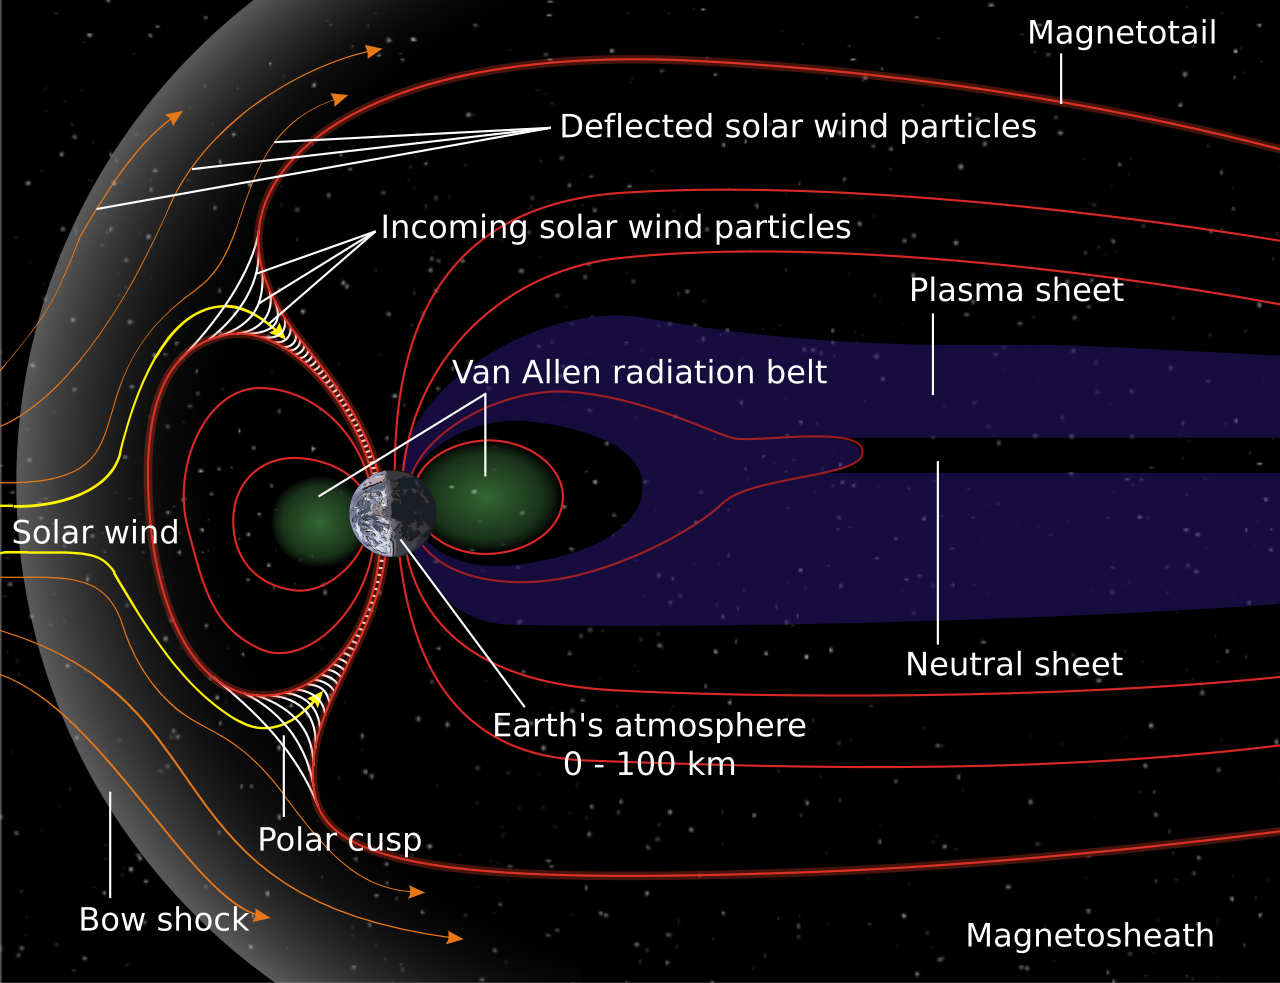
Schematic of Earth’s magnetosphere. The solar wind flows from left to right. (Wikipedia)
The solar wind is a continuous outflow of charged particles—mainly electrons and protons—from the Sun’s corona into the heliosphere. It carries the interplanetary magnetic field (IMF), a stretched-out extension of the Sun’s magnetic field.
There are two main types:
- Slow solar wind (~300–500 km/s): Originates near the solar equator, often from streamer belts.
- Fast solar wind (~600–800+ km/s): Emerges from coronal holes with open magnetic field lines.
When the solar wind interacts with Earth’s magnetosphere, it transfers energy through magnetic reconnection, especially if the IMF has a southward component. The interaction is influenced by wind speed, density, pressure, and IMF orientation.
Key effects include:
- Compression of the magnetosphere, increasing the risk of geomagnetic storms.
- Auroral activity from particle precipitation into the upper atmosphere.
- Satellite drag during sustained high-speed streams due to thermospheric expansion.
The solar wind’s variability drives the baseline level of space weather and modulates the impact of larger transient events like CMEs and high-speed streams.
Measurements from spacecraft like ACE, DSCOVR, and Wind provide near-real-time monitoring of the solar wind upstream of Earth for forecasting purposes.
Part 9: Geomagnetic Storms: Global Magnetic Disturbances
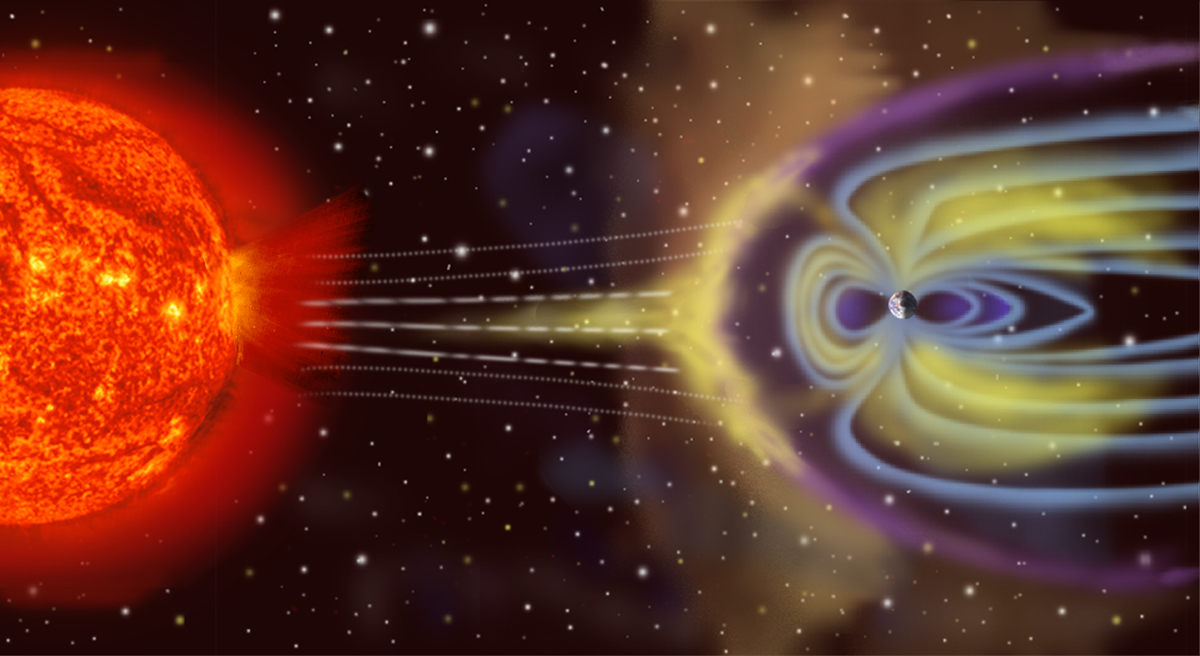
Artist’s depiction of solar wind particles interacting with Earth’s magnetosphere. Sizes are not to scale.
Geomagnetic storms are large-scale disturbances in Earth’s magnetosphere caused by enhanced solar wind–magnetosphere coupling, typically from CMEs or high-speed streams from coronal holes.
Storms are characterized by a sharp drop and gradual recovery in the Dst (Disturbance Storm Time) index, indicating the strength of the ring current. The Kp index is also used operationally to indicate geomagnetic activity on a 0–9 scale.
Storm severity (based on NOAA G-scale):
- G1 (Minor): Some HF radio and GNSS disruption; weak auroras.
- G2–G3 (Moderate–Strong): Satellite orientation issues, induced currents in pipelines, increased auroral visibility.
- G4–G5 (Severe–Extreme): Potential for widespread power grid disruptions, satellite damage, degraded navigation and radio systems, and high radiation doses at high altitudes.
Mechanisms during a storm include:
- Ring current intensification: Driven by energetic particle injection.
- Auroral electrojets: Strong currents in the ionosphere that can induce geomagnetically induced currents (GICs) in conductors on Earth.
- Ionospheric disturbance: Leading to signal degradation and position errors for GNSS users.
The onset and impact of a storm depend on the strength and duration of the southward IMF and the speed of the incoming solar wind.
Geomagnetic storms are among the most consequential space weather phenomena for modern infrastructure.
Part 10: Storm Strength vs. Impact: Why Intensity Matters
The impact of geomagnetic storms on Earth depends on their intensity, duration, and the vulnerability of affected systems. Storm strength is commonly measured using the Kp index (0–9) and the Dst index (in nanoteslas).
G1 (Kp=5)
- Minor power grid fluctuations.
- Minor satellite drag.
- Auroras at high latitudes.
G2 (Kp=6)
- Possible transformer damage during long storms.
- Increased satellite orientation corrections.
- Auroras visible in mid-latitudes.
G3 (Kp=7)
- Voltage corrections may be needed on power grids.
- Navigation systems can experience intermittent issues.
- HF radio may be degraded over large areas.
G4 (Kp=8)
- Power grid systems may experience widespread voltage control problems.
- Satellite anomalies become more likely.
- GNSS navigation and timing errors become significant.
- Auroras visible at low latitudes (e.g., northern U.S., central Europe).
G5 (Kp=9)
- Widespread power grid failures possible.
- High-frequency radio blackouts and severe GNSS disruption.
- Severe satellite damage risk.
- Auroras visible near the equator.
Dst Index: The Disturbance Storm Time (Dst) index measures the strength of the ring current around Earth, which intensifies during geomagnetic storms. It is expressed in nanoteslas (nT) and derived from low-latitude magnetometer data.
- Quiet conditions: Dst ≈ 0 nT
- Moderate storm: Dst < –50 nT
- Strong storm: Dst < –100 nT
- Severe storm: Dst < –200 nT
- Extreme storm: Dst < –300 nT
A more negative Dst indicates a stronger storm. Dst is particularly useful for quantifying the energy content of the magnetospheric ring current during storm main and recovery phases.
Impacts also depend on Earth’s internal and regional geomagnetic properties—certain locations are more prone to ground-induced currents (GICs), especially near high-latitude regions or long conductors like pipelines and undersea cables.
Understanding storm strength and forecasting its effects are essential for mitigating risks to aviation, space systems, communications, and power infrastructure.
Part 11: Magnetic Substorms: Localized Magnetospheric Disturbances

Magnetic substorms are localized disturbances in Earth’s magnetosphere that typically occur within the auroral regions. They are driven by the dynamic interaction between the solar wind, IMF, and Earth’s magnetosphere, often triggered by strong southward IMF during geomagnetic storms.
Substorms unfold in three phases:
- Growth Phase: Energy builds up in the magnetotail due to magnetospheric compression and reconnection at the magnetopause. The auroral oval expands, and currents flow along the ionosphere.
- Expansion Phase: A sudden release of stored magnetic energy causes rapid reconnection in the magnetotail, injecting energetic particles into Earth’s inner magnetosphere. This phase is characterized by bright auroras and intense geomagnetic activity.
- Recovery Phase: The magnetosphere relaxes, and the energy dissipates. Auroras fade, and geomagnetic activity decreases.
Key effects:
- Auroral intensification: Substorms enhance aurora activity, making them visible at lower latitudes.
- Satellite impact: High-energy particles from substorm injections can degrade satellite sensors and communications.
- GNSS and radio disruption: Substorms cause temporary ionospheric disturbances that can affect high-frequency radio and satellite navigation systems.
Substorms are a critical component of space weather, impacting both space operations and Earth-based systems, especially during major geomagnetic storms.
References:
- NASA, “Layers of the Sun.” NASA, nasa.gov (Accessed April 2025).
- NASA’s Solar Dynamics Observatory (SDO), “X-Class Solar Flare.” NASA, svs.gsfc.nasa.gov (Accessed April 2025).
- SIDC, “Filament Eruptions.” Solar Influences Data Center, sidc.be (Accessed April 2025).
- NOAA Space Weather Prediction Center (SWPC), “Coronal Holes.” NOAA, swpc.noaa.gov (Accessed April 2025).
- Montana State University, “Solar Radio Burst Spectrograms.” Solar Physics Group, solar.physics.montana.edu (Accessed April 2025).
- NASA, “Solar Energetic Particles (SEPs).” NASA, svs.gsfc.nasa.gov (Accessed April 2025).
- NOAA Space Weather Prediction Center (SWPC), “LASCO Coronagraph.” NOAA, swpc.noaa.gov (Accessed April 2025).
- UCLA, “The Parker Spiral: The Solar Wind.” University of California, Los Angeles, spacephysics.ucla.edu (Accessed April 2025).
- NASA’s Goddard Space Flight Center, “Earth’s Magnetosphere During a Geomagnetic Storm.” NASA, svs.gsfc.nasa.gov (Accessed April 2025).
- NOAA Space Weather Prediction Center (SWPC), “Planetary K-Index (Kp).” NOAA, swpc.noaa.gov (Accessed April 2025).
- Learmonth Solar Radio Spectrograph, “Solar Radio Spectra.” Bureau of Meteorology, sws.bom.gov.au (Accessed April 2025).
- NOAA Space Weather Scales swpc.noaa.gov/noaa-scales-explanation
/end